
It's the cover graphic for the GOP's famous "post mortem"report on the 2012 election. For the longest time, I thought it was just that: a graphic. But it's not! It's actually a highly accurate Venn diagram! Here, I labeled it for you:
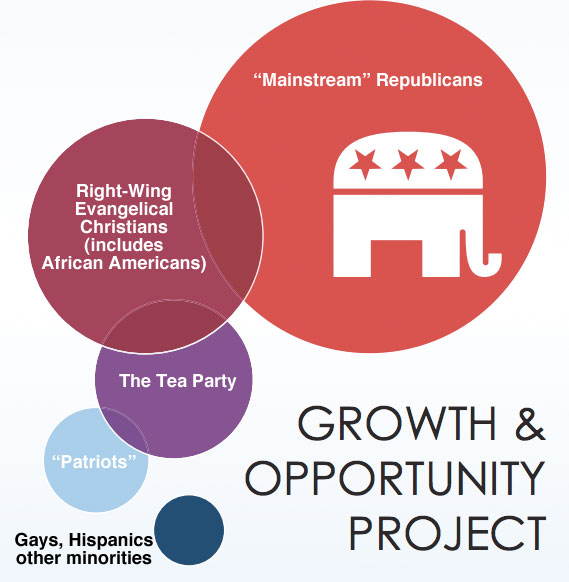
It isn't perfect (technically, the "Patriots" should also overlap with the Evangelical Christians, for instance), but still, tell me that isn't just about right.
NOTE: Some may be taken aback by my inclusion of African Americans wholly inside the "Evangelical Christian" group. Find me an African American Republican who ISN'T an evangelical Christian, and I'll admit the error (oh, right, Condi and Powell. OTHER than them).
2 comments:
Very clever, bro!
The genius in the layout of the diagram is I see no circle of a gay, Christian, Republican fan of Ayn Rand. Or maybe it is the left out circle on its own; or maybe it isn't. I think you may need to rely on hyperspace to artistically depict that dimension.
Post a Comment